・お題:バイオインフォマティクスなどのデータを可視化するOSSプラットフォームで、Cytoscapeというやつがあるらしい。Rでこれを弄ってみたい。
・Cytoscapeの公式サイトは以下。本来はソフトウェアとして使用するものらしいけれど、Rで動かすパッケージがあるので、今回はそっちからやってみたい。
・チュートリアルを探してみたところ、以下のサイトが分かりやすそうだったので、いつものようになぞって勉強させていただく。正しいことは元サイトをご確認いただきたい。
・インストールは割愛。ライブラリを起動する。
> library(RCy3)
> library(tidyverse)#いれておく
> library(RColorBrewer)
・タンパク質間相互作用ネットワーク情報を収集するために、STRINGappをインストールしておく。
> installApp('STRINGapp')
Oh no! I can't find Cytoscape. RCy3 can not continue!
Please check that Cytoscape is running, CyREST is installed and your base.url parameter is correct.
Error in .cyError(c, res) : object 'res' not found
Error in .cyFinally(res) : object 'res' not found
・なんだかめっちゃ怒られた。どうも、cytoscapeのソフトウェアそのものがインストールされていないとRCy3パッケージを使えないらしい。そりゃそうだ。以下のサイトを参考にしつつ、cytoscapeをインストール・起動してから、再挑戦してみた。
> installApp('STRINGapp')
App STRINGapp installed
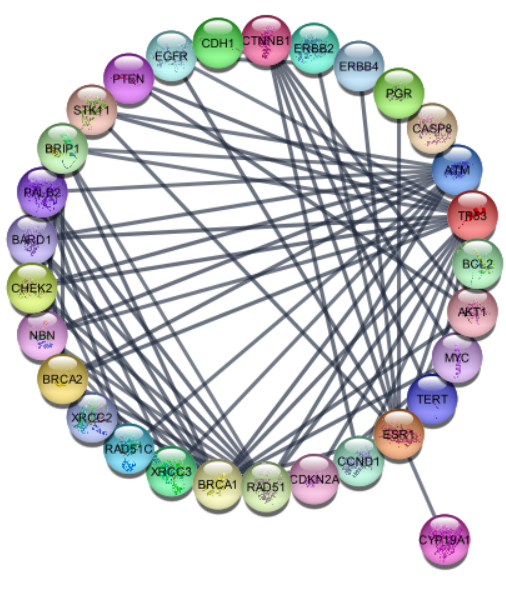
・どうもいけたっぽい。チュートリアルを参考に、乳がんのネットワークをRのコマンドで描いてみる。
> string.cmd = 'string disease query disease="breast cancer" cutoff=0.9 species="Homo sapiens" limit=150'
> commandsRun(string.cmd)
[1] "Loaded network 'STRING network - breast cancer' with 150 nodes and 847 edges"
・すると、cytoscapeが動いてひとりでにネットワークを描いてくれた。

・特定のタンパク質を検索して、ネットワークを描くこともできる。
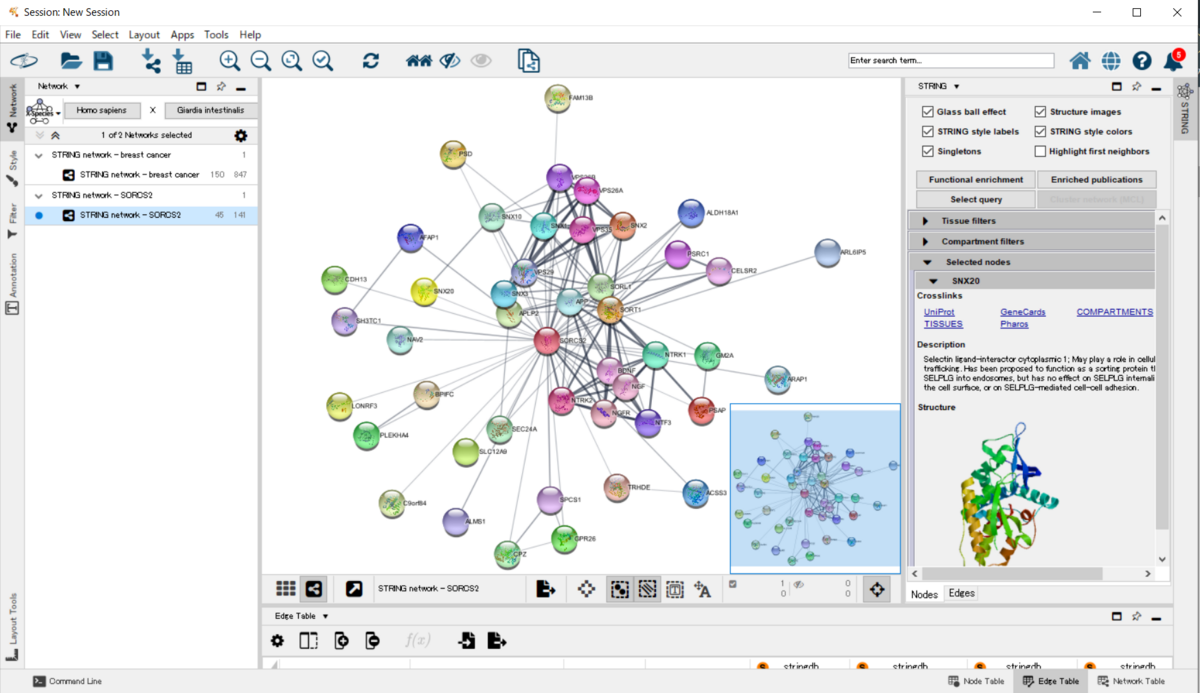
> string.cmd = 'string protein query query="SORCS2" species="Homo sapiens" limit=100'
> commandsRun(string.cmd)
[1] "Loaded network 'STRING network - SORCS2' with 45 nodes and 141 edges"
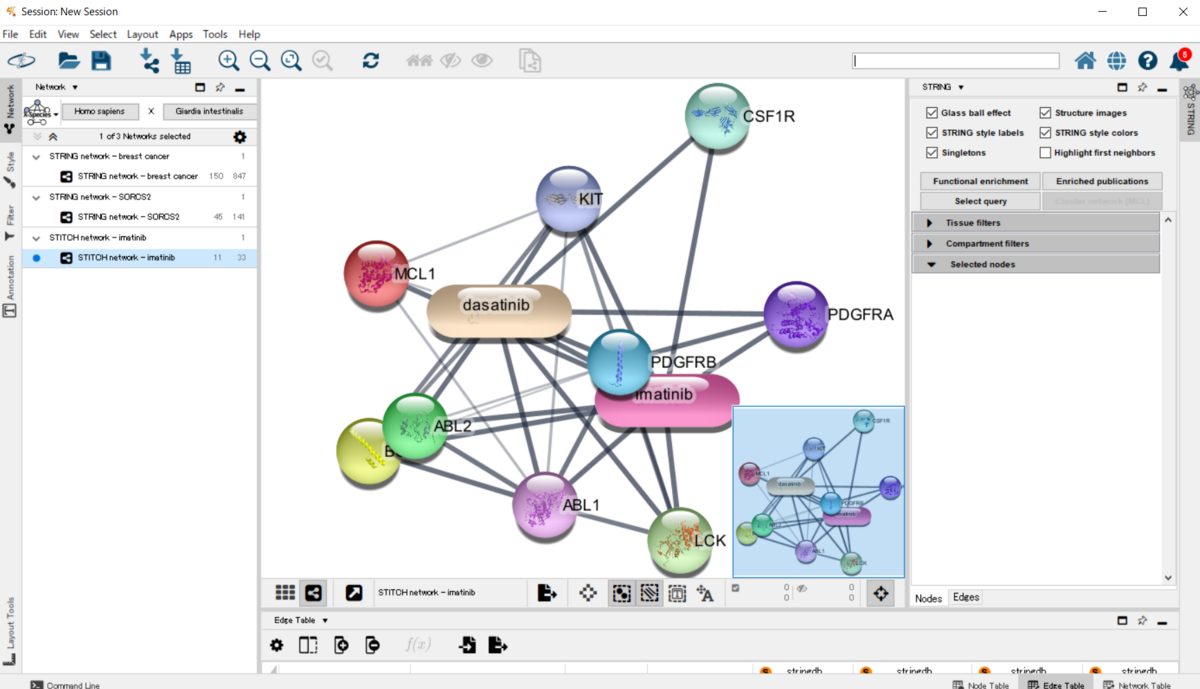
・薬でネットワークを釣ってくることもできる。
> string.cmd = 'string compound query query="imatinib" species="Homo sapiens"'
> commandsRun(string.cmd)
[1] "Loaded network 'STITCH network - imatinib' with 11 nodes and 33 edges"
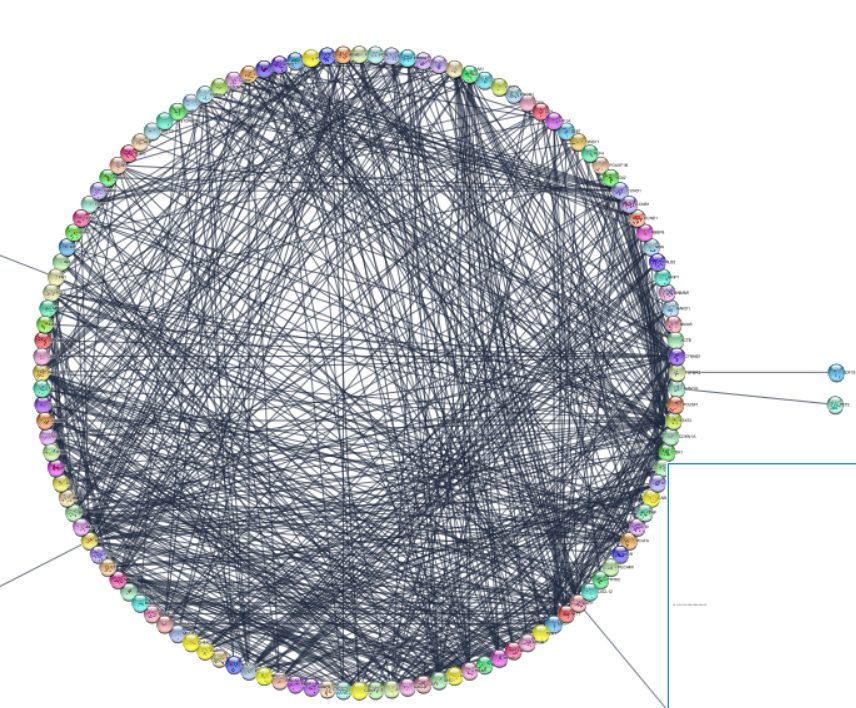
・乳がんのネットワークがごちゃごちゃして見づらい。レイアウトを何とか工夫したいところ。とりあえず、どんなレイアウトオプションがあるのか見てみる。
> getLayoutNames()
[1] "attribute-circle" "stacked-node-layout" "attribute-grid" "degree-circle"
[5] "circular" "attributes-layout" "kamada-kawai" "force-directed"
[9] "cose" "grid" "hierarchical" "fruchterman-rheingold"
[13] "isom" "force-directed-cl"
・試してみる。
> layoutNetwork(layout.name='circular')

・このネットワークには、様々な情報が格納されている。どのような情報が格納されているのか、覗いてみる。
>getTableColumnNames('node')

・疾患に関連しているスコアを抽出してみる。
> disease.score.table <- getTableColumns('node','stringdb::disease score')
> disease.score.table

・スコアで降順に並べてみる。
> disease.score.sorted <- disease.score.table[order(-disease.score.table$`stringdb::disease score`),,drop=FALSE]
> head(disease.score.sorted)

・このランキングトップ10を強調してみる。
> disease.score.sorted %>% head(.,10) %>% rownames() %>% selectNodes()
$nodes
[1] 527 545 851 533 821 518 806 554 602 605
$edges
list()
・いちおう黄色になっているものが強調されているらしいが、ごちゃごちゃして分かりにくくて仕方がない。最初にlimitを150よりも絞るという手もあるけれど、今回はサブネットワークを抽出してみる。
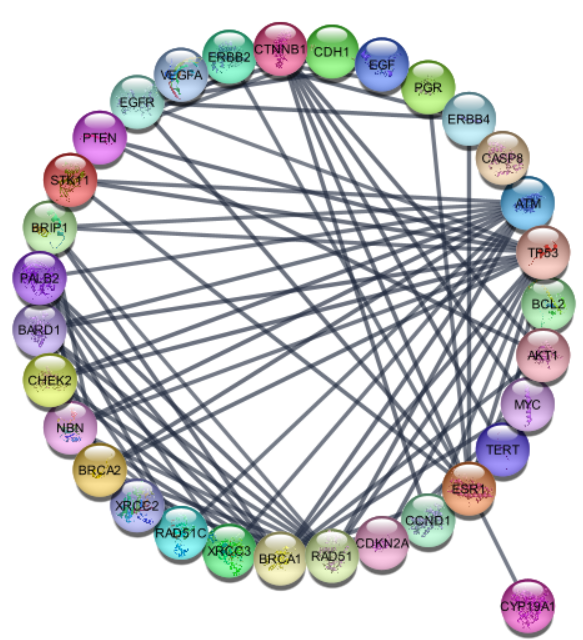
・まず、疾患スコアの上位25%を抽出する。
> top.quart <- quantile(disease.score.table[,1], 0.75)
> top.nodes <- row.names(disease.score.table)[which(disease.score.table[,1]>top.quart)]
> createSubnetwork(top.nodes,subnetwork.name ='top disease quartile')
network
6958

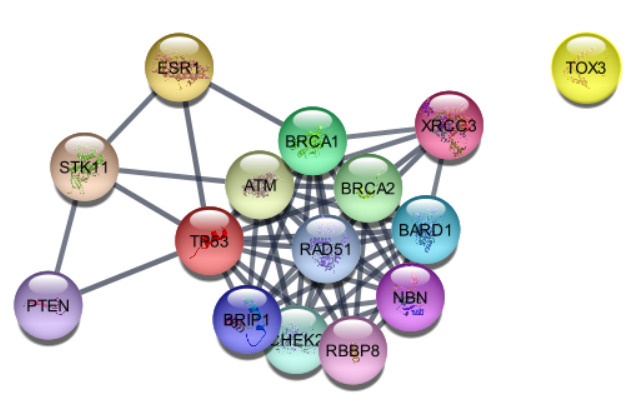
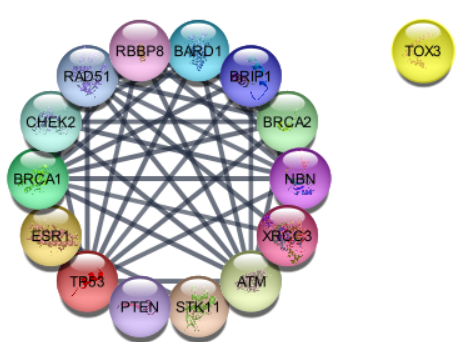
・次に、ネットワークに接続されていないノードを除去する。
> createSubnetwork(edges='all',subnetwork.name='top disease quartile connected')
> layoutNetwork(layout.name='circular')
・disease.scoreトップ3のノードをとってきて、その1次隣接ノードまでを抽出する。
> setCurrentNetwork(network="top disease quartile connected")
> disease.score.table <- getTableColumns('node','stringdb::disease score')
> disease.score.sorted <- disease.score.table[order(-disease.score.table$`stringdb::disease score`),,drop=FALSE]
> top.nodes <- row.names(disease.score.table)[tail(order(disease.score.table[,1]),3)]
> selectNodes(nodes=top.nodes)
$nodes
[1] 2039 2279 2030
$edges
list()
> selectFirstNeighbors()
$nodes
[1] 2288 1970 2291 2165 2039 1913 2042 1982 2051 2180 2249 1997 2189 2000 1937 2066 2003 1877 2072 2078
[21] 1886 2081 2210 1892 2021 2279 1964 2285 2030 2222
$edges
list()
> createSubnetwork('selected', subnetwork.name='top disease neighbors') # selected nodes, all connecting edges (default)
network
14852
> layoutNetwork(layout.name='circular')
・解析対象に一番最初のbreast cancerを指定し、トップ3から拡散モデルで1次隣接っぽいノードを抽出してみる。
> setCurrentNetwork(network="STRING network - breast cancer")
> disease.score.table <- getTableColumns('node','stringdb::disease score')
> disease.score.sorted <- disease.score.table[order(-disease.score.table$`stringdb::disease score`),,drop=FALSE]
> top.nodes <- row.names(disease.score.table)[tail(order(disease.score.table[,1]),3)]
> selectNodes(nodes=top.nodes)
$nodes
[1] 2039 2024 2030
$edges
list()
> commandsPOST('diffusion diffuse')
heatColumn rankColumn
"diffusion_output_heat" "diffusion_output_rank"
> createSubnetwork('selected',subnetwork.name = 'top disease diffusion')
network
15685
> layoutNetwork('force-directed')
> layoutNetwork('circular')
つづく。